4.7 - Pressure-Temperature Relationships
Module: Refrigeration Cycle Components Gauges and Pressure-Temperature Relationships
Course role: Explains how saturation pressure and saturation temperature are linked and how technicians use P-T data for saturation lookup, cylinder checks, noncondensable screening, and blend interpretation
Learning Objectives
After completing this section, a student should be able to:
- Determine saturation pressure from a known temperature using refrigerant P-T data.
- Determine saturation temperature from a known pressure using refrigerant P-T data.
- Explain why a refrigerant cylinder must be allowed to stabilize near thermal equilibrium before a static P-T comparison is meaningful.
- Use a stabilized P-T comparison as a screening tool for possible noncondensables, mixed refrigerant, incorrect refrigerant, or measurement error.
- Explain why operating system pressure is not automatically equivalent to a static saturation-pressure test.
- Select the correct bubble-point or dew-point value when using P-T data for zeotropic refrigerant blends.
Introduction
Every refrigerant has a characteristic relationship between:
Saturation pressure
↔
Saturation temperature
When a pure refrigerant exists as both liquid and vapor in equilibrium, pressure and temperature are linked. If the saturation temperature is known, the corresponding saturation pressure can be found. If the saturation pressure is known, the corresponding saturation temperature can be found.
This relationship is the basis of the refrigeration pressure-temperature chart, usually called a:
P-T chart
The basic technician logic is:
Known saturation temperature
→ P-T data
→ saturation pressure
or:
Known saturation pressure
→ P-T data
→ saturation temperature
P-T relationships support later work involving:
- Evaporating and condensing saturation temperatures.
- Superheat.
- Subcooling.
- Refrigerant identification checks.
- Cylinder contamination screening.
- Noncondensables.
- Refrigerant blends.
Before using any P-T data, ask:
1. What refrigerant is present?
2. What pressure units and pressure reference are used?
3. Is the condition actually at saturation?
Key Concepts
1. Saturation Pressure and Temperature Are Linked
For a pure refrigerant in liquid-vapor equilibrium:
One saturation temperature
↔
One saturation pressure
As saturation temperature rises, saturation pressure rises.
Therefore:
For a given refrigerant, higher saturation temperature means higher saturation pressure.
2. P-T Relationships Are Refrigerant Specific
Different refrigerants have different saturation pressures at the same temperature.
Therefore:
R-134a P-T data
≠
R-22 P-T data
≠
R-410A P-T data
Always use P-T data for the correct refrigerant.
3. P-T Data Is a Saturation Reference
P-T data applies directly to refrigerant at a saturation condition, including:
- Saturated liquid.
- Saturated vapor.
- A liquid-vapor mixture.
It does not mean that every actual refrigerant line temperature must equal the saturation temperature.
For example:
Superheated vapor
→ actual temperature above saturation temperature

Subcooled liquid
→ actual temperature below saturation temperature
Pressure-Temperature Charts
1. Basic Chart Structure
A pure-refrigerant P-T chart can be arranged as:
| Saturation Temperature | Saturation Pressure |
|---|---|
| Temperature 1 | Pressure 1 |
| Temperature 2 | Pressure 2 |
| Temperature 3 | Pressure 3 |
The same information can also be arranged by pressure first.
For a zeotropic blend, P-T data may provide separate:
- Bubble-point values.
- Dew-point values.
2. Confirm the Pressure Basis
Before comparing a gauge reading with a chart, determine whether pressure is expressed as:
- psig.
- psia.
- bar gauge.
- bar absolute.
- kPa gauge.
- kPa absolute.
Do not compare:
psig measurement
directly with:
psia table
without conversion.
From Section 4.6:
At standard sea-level conditions:
P_atm ≈ 14.7 psia
3. Use Verified Data
If a requested value is not shown in the provided table:
- Use a more detailed verified chart.
- Use manufacturer P-T software.
- Use an approved electronic P-T tool.
- Interpolate only when appropriate.
Do not invent a refrigerant P-T value from memory.
Saturation Pressure at a Known Temperature
1. Procedure
Use this sequence:
Identify refrigerant
↓
Determine refrigerant temperature
↓
Confirm saturation/equilibrium condition
↓
Find temperature in correct P-T data
↓
Read saturation pressure
↓
Confirm pressure units
2. Verified R-134a Example
Verified R-134a data used in this course includes:
| Saturation Temperature | Saturation Pressure |
|---|---|
| 25°F | 36.8 psia |
| 40°F | 49.7 psia |
At 40°F:
R-134a saturation pressure = 49.7 psia
Using the standard 14.7 psia atmospheric approximation:
At 25°F:
36.8 psia - 14.7 psia
≈ 22.1 psig
These gauge-pressure equivalents assume standard sea-level atmospheric pressure.
3. Temperature Must Represent the Refrigerant
A cylinder wall temperature can be a useful approximation of refrigerant temperature only after the cylinder has had time to stabilize.
A cylinder that has just been:
- Filled.
- Recovered into.
- Moved from one environment to another.
- Heated.
- Cooled.
- Left in direct sunlight.
may not yet be suitable for a static P-T comparison.
Saturation Temperature at a Known Pressure
1. Procedure
Use this sequence:
Identify refrigerant
↓
Measure pressure
↓
Confirm psig versus psia
↓
Locate pressure in correct P-T data
↓
Read saturation temperature
2. R-134a Example
If R-134a pressure is:
49.7 psia
verified P-T data indicates approximately:
40°F saturation temperature
At standard sea-level atmospheric pressure, the same condition is approximately:
35.0 psig
↔
40°F saturation
3. Saturation Temperature Is Not Automatically Actual Line Temperature
Suppose suction pressure corresponds to a saturation temperature of 40°F.
If the suction vapor is superheated:
Actual suction-line temperature > 40°F
Likewise, if liquid is subcooled:
Actual liquid-line temperature < saturation temperature
This relationship is used in Section 4.8.
Saturation and the Two-Phase Region
1. Pure Refrigerant
At a fixed saturation pressure, a pure refrigerant can pass through:
Saturated liquid
↔
liquid-vapor mixture
↔
saturated vapor
while remaining at approximately the same saturation temperature under ideal equilibrium conditions.
2. Latent Heat
During evaporation or condensation in the two-phase region, heat transfer primarily changes the liquid-vapor proportion.
For a pure refrigerant under ideal constant-pressure conditions:
Phase changes
while saturation temperature remains approximately constant
3. Outside the Two-Phase Region
After all liquid has evaporated:
Saturated vapor
→ Superheated vapor
After all vapor has condensed:
Saturated liquid
→ Subcooled liquid
P-T data remains the reference saturation condition.
Cylinder Stabilization
1. Why Stabilization Matters
A stationary refrigerant cylinder containing both liquid and vapor can be useful for a P-T consistency check, but only after the refrigerant has approached thermal equilibrium.
The proper sequence is:
Allow cylinder to stabilize
↓
Measure temperature
↓
Measure pressure
↓
Compare with correct refrigerant P-T data
2. Conditions That Disturb Equilibrium
A cylinder may need time to stabilize after:
- Recovery.
- Filling.
- Transport.
- Moving between indoor and outdoor environments.
- Sun exposure.
- Heating.
- Cooling.
- Significant refrigerant transfer.
3. No Universal Waiting Time
The required stabilization time depends on:
- Cylinder size.
- Refrigerant quantity.
- Initial temperature difference.
- Ambient conditions.
- Air movement.
- Cylinder construction.
Therefore:
Do not memorize one universal stabilization time.
Use sufficiently stable temperature and pressure for the intended comparison.
4. Two-Phase Sample Is Important
A simple static P-T cylinder check is most meaningful when both are present:
Liquid refrigerant
+
Refrigerant vapor
at equilibrium.
If only vapor remains, pressure depends on refrigerant mass, volume, and temperature and may not equal saturated vapor pressure.
Therefore:
A two-phase equilibrium sample is the appropriate condition for a simple saturation P-T check.
Static Cylinder Check Versus Operating System Pressure
1. Static Cylinder
A stabilized two-phase cylinder approaches one saturation pressure-temperature condition.
2. Operating System
A running refrigeration system contains:
- High-side pressure.
- Low-side pressure.
- Superheat.
- Subcooling.
- Pressure drop.
- Compressor work.
- Ongoing heat transfer.
Therefore:
Operating pressure is not automatically a static saturation-pressure test.
3. Incorrect Comparison
Do not compare:
Compressor discharge pressure
directly with:
Ambient-temperature cylinder saturation pressure
to identify refrigerant.
4. Correct Operating Use
During system operation, local pressure is commonly converted to local saturation temperature. That saturation temperature is then compared with the measured line temperature for:
- Superheat.
- Subcooling.
Pressure-Temperature Comparison as a Consistency Check
1. What It Can Tell You
A P-T comparison can answer:
Does the stabilized pressure-temperature behavior appear consistent with the expected refrigerant?
2. What It Cannot Prove
A P-T match does not prove:
- Laboratory purity.
- Correct blend composition.
- Correct refrigerant charge.
- Absence of all contaminants.
- Correct system operation.
Therefore:
P-T comparison is a consistency check, not a complete refrigerant analysis.
3. Causes of a Mismatch
Possible causes include:
- Wrong refrigerant.
- Mixed refrigerant.
- Noncondensables.
- Fractionation.
- Temperature measurement error.
- Pressure measurement error.
- Wrong P-T data.
- psig/psia confusion.
- Incomplete stabilization.
- No liquid phase present.
Identifying Possible Noncondensables
1. Pressure Effect
A noncondensable such as air can add to total pressure in a refrigerant cylinder.
Conceptually:
Total measured pressure
=
refrigerant vapor contribution
+
noncondensable-gas contribution
2. Higher-Than-Expected Pressure
If all of the following are true:
- Refrigerant identity is known.
- Liquid and vapor are both present.
- Cylinder is stabilized.
- Temperature is measured correctly.
- Pressure is measured correctly.
and the pressure is substantially higher than expected from the correct P-T data, possible noncondensables should be investigated.
3. High Pressure Is Not Automatic Proof
Higher-than-expected pressure can also result from:
- Wrong refrigerant.
- Mixed refrigerant.
- Wrong chart.
- Gauge error.
- Temperature error.
- Incomplete stabilization.
Therefore:
A high static pressure is a reason to investigate; it is not automatic proof of air contamination.
4. Lower-Than-Expected Pressure
Lower pressure can also require investigation for:
- Wrong refrigerant.
- Fractionated blend.
- No liquid phase remaining.
- Incorrect pressure or temperature measurement.
- Incomplete equilibrium.
Example - Stabilized Cylinder Screening
Assume a cylinder is labeled R-134a and contains both liquid and vapor.
After stabilization, the cylinder temperature is:
40°F
Verified data gives:
40°F ↔ 49.7 psia
or approximately:
40°F ↔ 35.0 psig
at standard sea-level atmospheric pressure.
If measured pressure is close to the expected value:
Behavior appears consistent with R-134a
This does not prove purity.
If pressure is significantly different:
Investigate
Possible causes include:
- Noncondensables.
- Wrong refrigerant.
- Mixed refrigerant.
- Measurement error.
- Incomplete stabilization.
No universal pressure-difference threshold should be memorized as proof of contamination.
Limitations With Refrigerant Blends
1. Pure Refrigerants and Azeotropes
A pure refrigerant has one saturation temperature at a given pressure.
An azeotropic blend behaves similarly for basic P-T chart use because it changes phase at essentially one temperature at a specified pressure.
2. Zeotropic Blends
A zeotropic blend can have two saturation boundaries at the same pressure:
Bubble point
and
Dew point
The difference is temperature glide.
3. Bubble Point
The bubble point is the saturated-liquid boundary.
Bubble point
→ liquid-side saturation reference
For a zeotropic blend:
Subcooling → Bubble
4. Dew Point
The dew point is the saturated-vapor boundary.
Dew point
→ vapor-side saturation reference
For a zeotropic blend:
Superheat → Dew
5. Memory Aid
Bubble → liquid
Dew → vapor
6. Do Not Automatically Average Bubble and Dew
If the task asks for:
- Saturated liquid reference.
- Saturated vapor reference.
- Superheat.
- Subcooling.
use the correct boundary rather than an automatic average.
Bubble and Dew Interpretation
During heating at approximately constant pressure:
Bubble point
→ first vapor forms
→ two-phase glide region
→ Dew point
→ last liquid evaporates
During cooling:
Dew point
→ first liquid forms
→ two-phase glide region
→ Bubble point
→ last vapor condenses
See Section 3.3 - Temperature Glide Bubble Point and Dew Point.
Blend P-T Chart Selection Process
Use this sequence:
Identify refrigerant
↓
Identify pressure
↓
Confirm pressure units
↓
Determine liquid or vapor reference
↓
Liquid → Bubble
Vapor → Dew
| Task | Zeotropic P-T Value |
|---|---|
| Saturated liquid reference | Bubble |
| Saturated vapor reference | Dew |
| Subcooling | Bubble |
| Superheat | Dew |
Fractionation and P-T Limitations
1. Composition Can Change
A zeotropic blend can fractionate if components are preferentially lost.
A composition change can alter:
- Bubble point.
- Dew point.
- Glide.
- Overall P-T behavior.
2. Recovery Does Not Restore Composition
Recovering the remaining refrigerant captures what remains; it does not restore a fractionated blend to its original manufactured composition.
3. P-T Check Cannot Fully Analyze a Blend
P-T comparison can show whether behavior is consistent or inconsistent, but it cannot determine exact component percentages.
If composition remains uncertain, additional analysis may be required.
Using P-T Data for Refrigerant Identification
1. Supporting Evidence
Use reliable identification information first, such as:
- Equipment nameplate.
- Retrofit label.
- Cylinder label.
- Service history.
Then use P-T behavior as supporting evidence.
2. Pressure Alone Is Not Enough
Pressure changes with temperature, and different refrigerants can have similar pressures under some conditions.
3. Temperature Alone Is Not Enough
Many refrigerants can exist at the same temperature at different pressures.
4. Unknown Refrigerant
If identity remains uncertain:
Do not mix it with known refrigerant.
A refrigerant analyzer or other approved identification method may be needed.
P-T Chart Reading Procedure
Step 1 - Identify Refrigerant
Confirm the refrigerant designation.
Step 2 - Determine What Is Known
Is the problem giving:
- Temperature?
- Pressure?
Step 3 - Confirm Pressure Units
Check:
psig or psia?
Step 4 - Determine Phase Reference
For a pure refrigerant:
one saturation reference
For a zeotropic blend:
Liquid → Bubble
Vapor → Dew
Step 5 - Read the Chart
Known temperature → saturation pressure
Known pressure → saturation temperature
Step 6 - Interpret Only What the Data Supports
Decide whether the result is being used for:
- Saturation condition.
- Cylinder consistency check.
- Superheat reference.
- Subcooling reference.
- Identification screening.
Do not extend the conclusion beyond the measurement.
Technical Details
1. Two-Phase Cylinder Pressure Does Not Indicate Refrigerant Mass
While both liquid and vapor remain at equilibrium, saturation pressure is primarily controlled by temperature.
Therefore:
Cylinder pressure does not directly tell how much refrigerant remains while a liquid phase is present.
Use a scale to determine mass.
2. Vapor-Only Cylinder Behaves Differently
If all liquid is gone, pressure depends on:
- Vapor mass.
- Cylinder volume.
- Temperature.
The simple saturated two-phase P-T relationship no longer applies automatically.
3. Measurement Location Matters
Operating systems have pressure drop through:
- Evaporators.
- Condensers.
- Refrigerant lines.
- Valves.
- Filter-driers.
For superheat or subcooling, pressure and temperature should represent corresponding locations.
4. Instrument Error Matters
A P-T mismatch can be caused by:
- Gauge calibration error.
- Temperature-probe error.
- Poor thermal contact.
- Measurements taken at different locations.
5. Electronic Tools Still Require Correct Selection
A digital manifold may automatically convert pressure to saturation temperature, but the technician must still select:
- Correct refrigerant.
- Correct pressure basis.
- Correct bubble/dew reference.
Important Terms
Bubble Point
The bubble point is the saturated-liquid temperature of a zeotropic refrigerant blend at a specified pressure.
Dew Point
The dew point is the saturated-vapor temperature of a zeotropic refrigerant blend at a specified pressure.
Equilibrium
Equilibrium is a stable thermodynamic condition in which the refrigerant phases, temperature, and pressure are sufficiently stable for the intended comparison.
Noncondensable
A noncondensable is a gas, such as air under normal refrigeration conditions, that does not condense with the refrigerant at the normal condensing condition.
Pressure-Temperature Chart
A pressure-temperature chart relates refrigerant saturation pressure and saturation temperature.
Saturation Pressure
Saturation pressure is the pressure at which liquid and vapor can coexist in equilibrium at a specified saturation temperature.
Saturation Temperature
Saturation temperature is the temperature at which liquid and vapor can coexist in equilibrium at a specified saturation pressure.
Temperature Glide
Temperature glide is the difference between dew-point and bubble-point temperatures of a zeotropic blend at the same pressure.
Figures and Diagrams
Figure 4.7.1
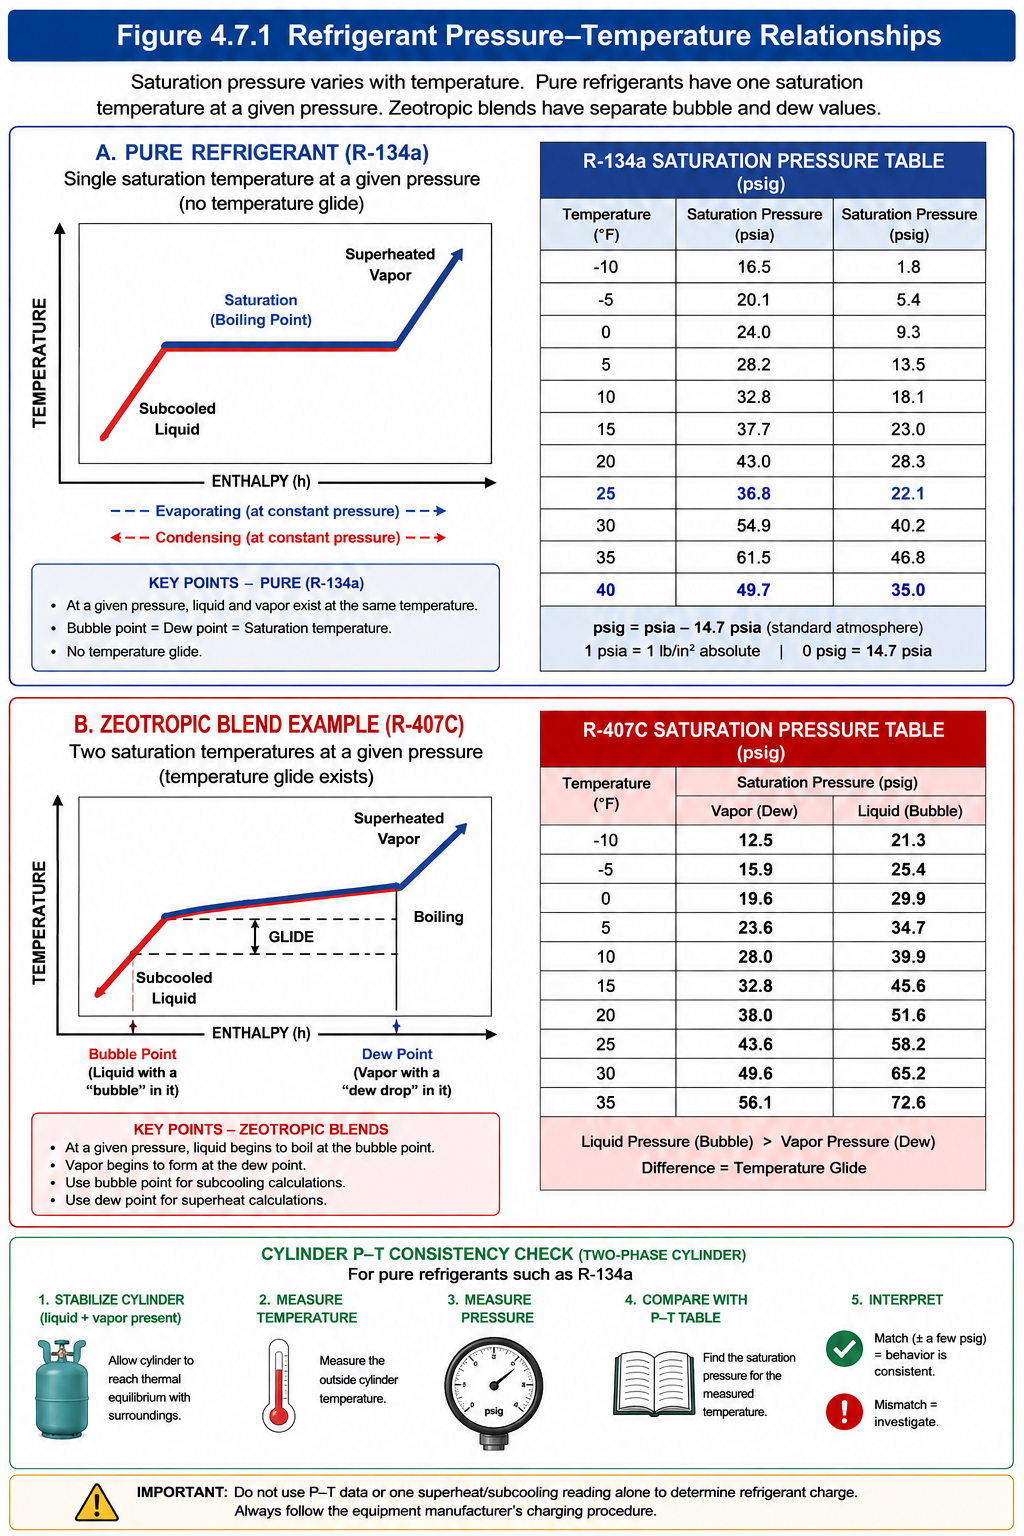
Figure 4.7.1 – Reading refrigerant saturation pressure and saturation temperature from P-T data.
AI-generated instructional figure: It may contain visual inaccuracies. Use the accompanying lesson text and cited authoritative sources to verify technical and regulatory details.
EPA 608 Exam Focus
What Students Must Remember
- P-T data relates saturation pressure and saturation temperature.
- Higher saturation temperature means higher saturation pressure.
- Always use the correct refrigerant P-T chart.
- Confirm whether pressure is psig or psia.
- P-T data is a saturation reference.
- Superheated vapor temperature is above saturation temperature at the same pressure.
- Subcooled liquid temperature is below saturation temperature at the same pressure.
- A static cylinder check should use a stabilized two-phase sample.
- Higher-than-expected stabilized pressure can indicate possible noncondensables, wrong refrigerant, mixed refrigerant, or measurement error.
- A mismatch requires investigation; it does not automatically prove contamination.
- P-T agreement does not prove purity.
- Running-system pressure is not the same as a stabilized cylinder test.
- For a zeotropic blend:
- Bubble = saturated liquid.
- Dew = saturated vapor.
- Subcooling → Bubble.
- Superheat → Dew.
- Pressure alone does not identify an unknown refrigerant.
High-Priority Comparison Table
| Exam Clue | Correct Concept |
|---|---|
| Known temperature, need saturation pressure | Use P-T chart |
| Known pressure, need saturation temperature | Use P-T chart |
| Wrong refrigerant chart | Invalid comparison |
| Stabilized two-phase cylinder | Suitable for P-T consistency check |
| Operating discharge pressure | Not a simple static cylinder test |
| Static pressure higher than expected | Investigate; do not assume one cause |
| P-T agreement | Consistent behavior, not proof of purity |
| Zeotropic liquid reference | Bubble |
| Zeotropic vapor reference | Dew |
| Superheat reference | Dew |
| Subcooling reference | Bubble |
Typical Exam Question Patterns
Students may be asked to:
- Find saturation pressure from temperature.
- Find saturation temperature from pressure.
- Convert psia and psig before using a chart.
- Explain cylinder stabilization.
- Identify why a two-phase sample is needed.
- Identify possible causes of a P-T mismatch.
- Explain why P-T agreement does not prove purity.
- Select bubble point for a liquid-side reference.
- Select dew point for a vapor-side reference.
Common Mistakes and Confusing Points
Mistake 1: Using the Wrong Refrigerant Chart
Each refrigerant has its own P-T relationship.
Mistake 2: Confusing psig and psia
Always confirm the pressure basis.
Mistake 3: Treating Actual Line Temperature as Saturation Temperature
Superheated vapor and subcooled liquid do not have actual temperatures equal to saturation temperature.
Mistake 4: Checking a Cylinder Before It Stabilizes
Allow the cylinder and refrigerant to approach thermal equilibrium first.
Mistake 5: Memorizing One Stabilization Time
There is no universal waiting time.
Mistake 6: Assuming High Static Pressure Proves Air
Noncondensables are one possible cause, not the only cause.
Mistake 7: Assuming P-T Agreement Proves Purity
A P-T check is a consistency screen, not a composition analysis.
Mistake 8: Treating Every Blend Like a Pure Refrigerant
Zeotropic blends can require separate bubble and dew references.
Mistake 9: Using Bubble Point for Superheat
Correct:
Superheat → Dew
Mistake 10: Using Dew Point for Subcooling
Correct:
Subcooling → Bubble
Concept-Check Questions
Question 1
What information does a refrigerant pressure-temperature chart primarily relate?
A. Compressor amperage and refrigerant mass
B. Saturation pressure and saturation temperature
C. Airflow and refrigerant pressure drop
D. Oil viscosity and condensing temperature
Question 2
Verified R-134a data shows a saturation pressure of 49.7 psia at 40°F. Assuming standard atmospheric pressure of 14.7 psia, what is the approximate gauge pressure?
A. 35.0 psig
B. 49.7 psig
C. 64.4 psig
D. 14.7 psig
Question 3
Why should a refrigerant cylinder be allowed to stabilize before performing a static P-T comparison?
A. The refrigerant must chemically react with the cylinder wall first.
B. The cylinder must become completely empty of vapor.
C. Temperature and pressure should approach a representative equilibrium condition before comparison.
D. Stabilization converts every refrigerant blend into an azeotrope.
Question 4
A stabilized two-phase cylinder of a known refrigerant has a pressure significantly higher than expected from the correct P-T data. What is the best conclusion?
A. Noncondensables are definitely present.
B. The cylinder is definitely overfilled.
C. The refrigerant is definitely a higher-pressure refrigerant.
D. The mismatch requires investigation for causes such as noncondensables, wrong or mixed refrigerant, or measurement error.
Question 5
Why is compressor discharge pressure not normally compared directly with ambient-temperature cylinder P-T data to identify refrigerant?
A. A running system contains pressure differences, superheat, subcooling, and active heat transfer rather than one static equilibrium condition.
B. Discharge pressure is always below atmospheric pressure.
C. Refrigerant pressure cannot be measured while a compressor operates.
D. P-T data applies only to water.
Question 6
For a zeotropic refrigerant blend, which P-T value represents the saturated-vapor boundary?
A. Bubble point
B. Freezing point
C. Dew point
D. Critical point
Question 7
Which P-T reference is normally used when calculating subcooling for a zeotropic blend?
A. Dew point
B. Bubble point
C. Critical temperature
D. Average of bubble and dew in every case
Question 8
Which statement best describes refrigerant identification using pressure-temperature data?
A. One pressure reading by itself uniquely identifies any refrigerant.
B. Exact P-T agreement proves laboratory purity.
C. P-T comparison is a consistency check that should be used with refrigerant identification, temperature, pressure, and system-condition information.
D. P-T data is unnecessary when a cylinder has a color code.
Answers and detailed explanations will be provided in
4.11 - Answers and Explanations.md.
Section Summary
A refrigerant P-T chart relates:
Saturation pressure
↔
Saturation temperature
For a known refrigerant at saturation:
Known temperature → saturation pressure
Known pressure → saturation temperature
Before using P-T data:
Identify refrigerant
+
confirm pressure units
+
confirm saturation condition
For a stationary cylinder check:
Use a two-phase sample
→ stabilize
→ measure temperature
→ measure pressure
→ compare with correct P-T data
A mismatch can indicate noncondensables, wrong or mixed refrigerant, fractionation, measurement error, or incomplete stabilization. It does not automatically prove one specific problem.
For zeotropic blends:
Bubble
→ saturated liquid
→ subcooling reference

Dew
→ saturated vapor
→ superheat reference
The next section uses these saturation references to calculate and interpret superheat and subcooling.
See Section 4.8 - Superheat and Subcooling.
References
Project Source
- Current EPA Section 608 teaching-material project outline, Module 4 — Refrigeration Cycle Components Gauges and Pressure-Temperature Relationships, Section 4.7. Required scope: saturation pressure at known temperature, saturation temperature at known pressure, cylinder stabilization, identifying possible noncondensables, limitations with blended refrigerants, bubble/dew values where applicable, and Figure 4.7.1.
EPA 608 Teaching Reference
- International Training Institute for the Sheet Metal and Air Conditioning Industry, EPA Section 608 Study Guide. Refrigerant identification and servicing material uses pressure-temperature relationships as a refrigerant consistency and service reference.
HVAC Technical References
-
Justin Kauwale, Mechanical PE: HVAC & Refrigeration Textbook, 2025 ed., vapor-compression refrigeration discussion. The text provides R-134a examples of 36.8 psia at 25°F saturation and 49.7 psia at 40°F saturation.
-
NCEES, PE Mechanical Reference Handbook, Version 2.0, Chapter 8, refrigeration property tables and charts. The handbook provides refrigerant thermodynamic data and separate liquid-bubble-line and vapor-dew-line information for applicable blends.
-
Rex Miller and Mark R. Miller, HVAC Licensing Study Guide, 3rd ed., refrigerant-property discussion. The text explains that refrigerant pressure increases with temperature and discusses pressure-temperature behavior of refrigerant blends.
-
Edward G. Pita, Air Conditioning Principles and Systems: An Energy Approach, 4th ed., refrigeration and phase-change fundamentals supporting the saturation, superheat, and subcooling framework.